What is Brewit?
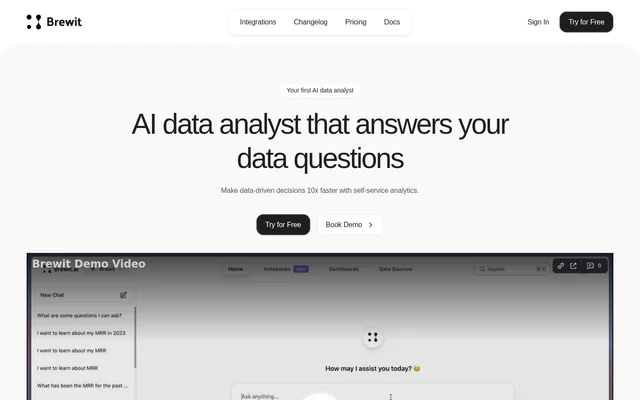
Brewit is a self-service data analysis tool that connects to databases and data warehouses and lets users ask questions about the data in chat. Brewit is intended for people who want to explore data and present their findings in reports or dashboards. The website describes a workflow that starts with a connected data source and brings querying, visualization, and reporting into the same tool.
What Brewit can do
Brewit can write SQL queries and create recommended charts based on a user's data question. The built-in data catalog and automated semantic layer serve a different purpose: they are designed to help Brewit apply the correct business logic and answer questions consistently. The notebook editor provides a place to organize the resulting analysis in a report or dashboard.
- Brewit writes SQL queries based on data questions.
- Brewit recommends and creates charts.
- Brewit supports drill-down analysis.
- Brewit lets users manage a data catalog and dictionary.
- Brewit provides a notebook editor for reports and dashboards.
How Brewit works with connected data
Brewit starts with a connection to a database or data warehouse. The website names Postgres, MySQL, Snowflake, and BigQuery among the available integrations. Once a source is connected, users ask data questions through chat. Brewit can respond by writing SQL and creating a chart suited to the question. Users can then drill down into the initial analysis rather than stopping at the first result.
Who Brewit is for
Brewit is for people who want to answer questions about records in a database or warehouse and explain what they find. A user who starts with a broad question can look at a recommended chart before exploring the results in more detail. Someone preparing a report can use the Notion-style notebook editor to organize the analysis into a report or dashboard.
- Explore data through a chat interface.
- Generate a SQL query for a data question.
- Follow up on a chart with a more detailed analysis.
- Present findings in a report or dashboard.
Brewit pricing and plans
Brewit provides a Get Started option on its website, including in the supplied pricing page text. That text does not list a subscription price, describe specific plans, or say whether users can start for free. The available information therefore identifies where to begin but does not establish what access costs or which features might be included in a particular plan.
Strengths and limitations of Brewit
Brewit combines database chat, query generation, charts, and reporting in a single workflow. The catalog and semantic layer address consistency in how business logic is applied, while the notebook editor addresses how findings are presented. The workflow described on the site starts with connecting a database or warehouse. The page names several integrations but directs readers to a separate integrations list for the full set.
Brewit FAQ
What is Brewit?
Brewit is a self-service data analysis tool that lets people ask questions about connected databases and data warehouses. Brewit can write SQL queries, create recommended charts, help users drill down into results, and provide a notebook editor for reports and dashboards.
Is Brewit free?
Brewit does not say whether free access is available in the supplied pricing page text. The page offers a Get Started option, but it does not list prices or explain what any plan includes.
Which databases and data warehouses does Brewit support?
Brewit lists Postgres, MySQL, Snowflake, and BigQuery among its database and data warehouse integrations. The website indicates that other integrations are available and links to a separate list without naming them in the supplied page text.
Can Brewit generate SQL and charts from questions?
Brewit can write SQL queries and create recommended charts based on questions about data in a connected database or warehouse. Brewit also supports drill-down analysis so users can explore the results of an initial question in more detail.
Can Brewit build reports and dashboards?
Brewit includes a Notion-style notebook editor for creating reports and dashboards. The editor is part of the same tool that lets users ask data questions, generate SQL queries, create charts, and explore the results.
From the community
No reviews yet
Be the first to review this tool. What you write helps the next person choose.