What is ChartPixel?
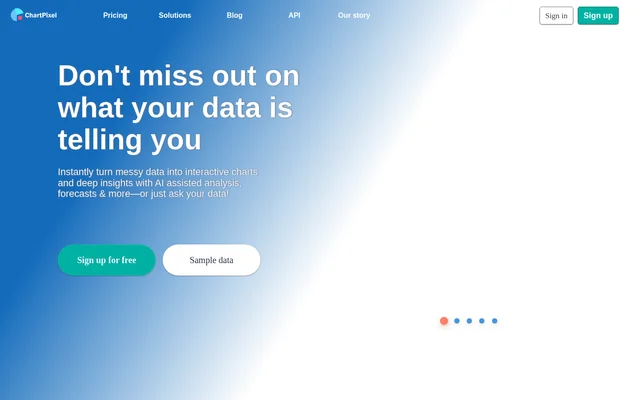
ChartPixel is a no-code data analysis tool that converts spreadsheets and other tabular data into interactive visualizations and written explanations. ChartPixel combines AI-assisted analysis with statistical methods to help users identify patterns, correlations and forecasts. The intended audience includes people learning data analysis as well as professionals working with research or business data.
ChartPixel emphasizes guided exploration rather than requiring users to select every column, chart type or formatting option manually. ChartPixel also explains charts through titles, descriptions and key takeaways. These explanations support users who need to understand a dataset, communicate findings or explore statistical relationships without time-consuming coding work.
What ChartPixel can do
ChartPixel handles data preparation, visualization and interpretation within the same workflow. ChartPixel automatically selects relevant columns and chart types, while written insights explain the resulting visualizations. Additional capabilities cover geographic data, survey comments and forecasts, with options to customize and distribute the results.
- ChartPixel cleans missing values, country codes, units and currencies.
- ChartPixel creates interactive charts with explanatory titles and insights.
- ChartPixel produces forecasts and supports statistical tests.
- ChartPixel analyzes sentiment in comments.
- ChartPixel creates maps from country data and zip codes.
- ChartPixel supports conversations with data and charts.
- ChartPixel exports charts and insights into PowerPoint.
How ChartPixel works
ChartPixel starts with an Excel or CSV upload, with additional options for reading website tables and using keyword search. ChartPixel then tidies and enhances the data, selects columns and generates charts without requiring users to choose chart types first. Each chart comes with written insights that explain the findings.
ChartPixel lets users customize the output, share charts online, embed visualizations or publish a project through a link. Guided exploration offers help with column selection for further analysis. ChartPixel also provides sample datasets, including survey responses, AI job salaries and stock market data, so users can examine the workflow before uploading their own files.
Who ChartPixel is for
ChartPixel serves students, teachers, researchers, data analysts, business owners and journalists. ChartPixel supports educational use without requiring students to learn coding first, while researchers can explore patterns backed by statistical methods. Business users can examine data drivers and forecasts, and journalists can create charts without extensive data analysis experience.
- ChartPixel helps educators introduce data exploration through visual examples.
- ChartPixel helps researchers examine patterns and statistical relationships.
- ChartPixel helps businesses analyze customer surveys and forecasts.
- ChartPixel helps journalists create visualizations for reporting.
- ChartPixel helps hobby analysts explore sports statistics and personal datasets.
ChartPixel pricing and plans
ChartPixel offers a Free plan at $0 and a Silver subscription listed at AU$ 15.00 per month billed annually. The Free plan includes automated cleaning, AI-assisted analysis and link sharing, but limits users to 1 data import, 1 stored free project, 10 chat prompts and 50 customization actions.
ChartPixel Silver includes unlimited data imports and unrestricted customization, with files limited to 10,000 rows, 64 columns and 20 MB. Silver includes storage for up to 20 projects, column encryption and 1000 chat prompts per month. The Free plan excludes API access and column encryption, while Silver excludes priority support.
ChartPixel strengths and limitations
ChartPixel combines automated data cleaning, chart selection and statistical explanations, reducing the manual steps involved in exploring a spreadsheet. ChartPixel also states that user data is not used for training and raw data is not sent to external LLMs. Access and capacity depend on the chosen plan, so the free offering is more constrained than Silver.
- ChartPixel Free restricts imports, customization and chat usage.
- ChartPixel Free does not provide API access or column encryption.
- ChartPixel Silver retains file, project storage and monthly chat limits.
- ChartPixel Silver does not provide priority support.
ChartPixel FAQ
What is ChartPixel?
ChartPixel is a no-code, AI-assisted data analysis tool that turns spreadsheets and webpage tables into interactive charts, written insights and forecasts. ChartPixel automates data cleaning and chart selection, with statistical explanations for beginners and professional users.
Is ChartPixel free?
ChartPixel offers a Free plan at $0 with limited imports, customization and chat prompts. ChartPixel also offers a Silver subscription at AU$ 15.00 per month billed annually, adding unlimited imports, unrestricted customization and expanded analysis options subject to file and usage limits.
What file types can ChartPixel analyze?
ChartPixel accepts Excel and CSV uploads and can read tables from websites. ChartPixel automatically cleans and enhances uploaded data before creating charts with written insights. Sample datasets are also available for exploring survey responses, job salaries and stock market analysis.
Can ChartPixel export and share charts?
ChartPixel supports PowerPoint export, online chart sharing, embedded charts and publishing entire projects through a link. ChartPixel includes written insights alongside charts, while download and customization options depend on the selected plan.
Does ChartPixel use uploaded data to train AI?
ChartPixel states that user data is not used for training and that raw data is not sent back and forth to external LLMs. ChartPixel describes its approach as combining AI with domain expertise, while column encryption is included in Silver but excluded from the Free plan.
From the community
No reviews yet
Be the first to review this tool. What you write helps the next person choose.