What is ChartGPT?
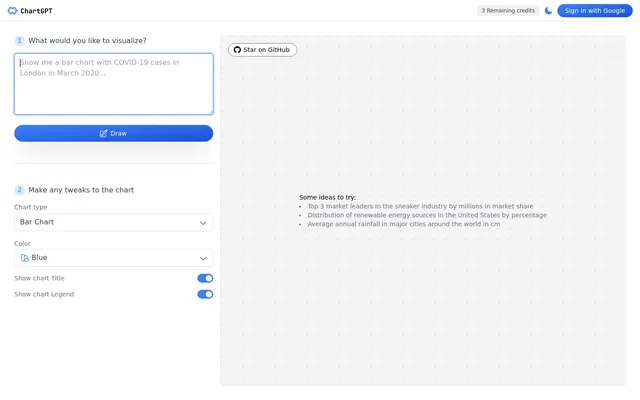
ChartGPT is a chart creation tool with a prompt-based interface and controls for adjusting the resulting chart. ChartGPT is suited to people who want to describe a comparison or distribution and then change its presentation. The page introduces the workflow by asking what the user would like to visualize.
ChartGPT illustrates possible requests through examples involving sneaker industry market share, renewable energy sources in the United States, and rainfall in major cities. These examples establish the kinds of visualization requests presented on the page. Google sign-in and a Star on GitHub link also appear in the interface.
What ChartGPT can do
ChartGPT combines a visualization request field with a Draw action and chart presentation controls. The visible options focus on choosing how a chart looks after the initial request. Chart type and color appear alongside controls for the title and legend, giving users several distinct aspects of the chart to adjust.
- ChartGPT accepts a request describing what to visualize.
- ChartGPT provides a Draw action for the visualization request.
- ChartGPT includes a control for chart type.
- ChartGPT includes a control for chart color.
- ChartGPT provides options for showing the chart title.
- ChartGPT provides options for showing the chart legend.
- ChartGPT supplies example visualization prompts.
How ChartGPT works
ChartGPT presents a workflow that moves from describing a visualization to making chart adjustments. The opening prompt asks what the user would like to visualize, with Draw as the associated action. The following part of the interface invites users to make tweaks to the chart through the displayed controls.
ChartGPT places chart type, color, title and legend settings in the adjustment step. ChartGPT also displays a Google sign-in option, but the supplied text does not explain whether signing in is required before drawing a chart. The example prompts provide starting ideas without describing any separate data-upload or configuration process.
Who ChartGPT is for
ChartGPT is relevant to people preparing charts that compare categories or show distributions. The page's examples span market share, energy sources and rainfall rather than identifying a particular profession or industry as the intended audience. Those examples give concrete starting points for users deciding what information they want to visualize.
- ChartGPT suggests comparing sneaker industry market leaders by market share.
- ChartGPT suggests visualizing the percentage distribution of renewable energy sources in the United States.
- ChartGPT suggests comparing average annual rainfall in major cities around the world.
ChartGPT strengths and documented scope
ChartGPT brings the initial visualization request and subsequent presentation adjustments into the same visible workflow. ChartGPT provides separate controls for chart type, color, title and legend, while example prompts help explain the kinds of requests users can enter. These are the concrete capabilities documented in the supplied page text.
ChartGPT FAQ
What is ChartGPT?
ChartGPT is a chart creation tool with a visualization prompt, a Draw action and chart adjustment controls. ChartGPT provides options for chart type, color, title and legend, plus example prompts covering market share, renewable energy and rainfall.
How do you create a chart with ChartGPT?
ChartGPT presents a prompt asking what the user would like to visualize, followed by a Draw action. ChartGPT then presents a chart-tweaking step with controls for chart type, color, title and legend.
Can you customize charts in ChartGPT?
ChartGPT includes chart customization controls for chart type and color, along with options for showing the title and legend. ChartGPT presents these settings in the step labeled Make any tweaks to the chart.
What can you visualize with ChartGPT?
ChartGPT provides example requests for sneaker industry market share, renewable energy source distribution in the United States, and average annual rainfall in major cities. ChartGPT presents these as ideas to try rather than an exhaustive list of supported topics.
Does ChartGPT offer Google sign-in?
ChartGPT displays a Sign in with Google option on its page. ChartGPT's supplied page text does not explain whether signing in is required to draw charts or what account-specific functionality is available after signing in.
From the community
No reviews yet
Be the first to review this tool. What you write helps the next person choose.