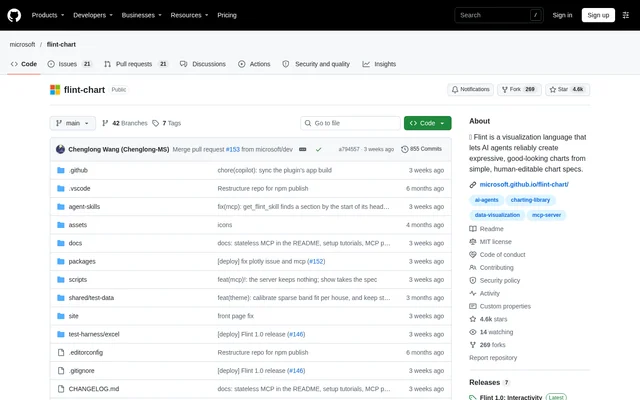
What is flint-chart?
flint-chart is an open-source visualization language for creating charts from simple, human-editable specifications. Published in Microsoft's GitHub repository under the MIT license, flint-chart supports both AI agents generating charts and developers embedding visualizations in applications. The project provides an MCP server for conversational use and an npm library for application development.
flint-chart combines data, semantic types, chart definitions, themes, and interactions in a unified specification. The compiler resolves these inputs together and produces a complete backend-native chart specification. This approach supports shared chart authoring across Vega-Lite, ECharts, Chart.js, Plotly, and native Excel charts.
What flint-chart can do
flint-chart covers chart generation, styling, interaction, and export through a shared interface. The source lists 52 chart types, 14 preset themes, and 23 interaction presets. Custom themes can be designed in the Theme Lab, while the interaction API connects chart events to application behavior.
- flint-chart renders charts through Vega-Lite, ECharts, Chart.js, Plotly, and native Excel backends.
- flint-chart infers parsing, scales, axes, formatting, and colors from semantic types.
- flint-chart supports reusable themes with inheritance and selective overrides.
- flint-chart exposes React and vanilla JavaScript APIs for interactive chart embedding.
- flint-chart can return static PNG or SVG output and backend-native specifications.
- flint-chart supports editable Excel charts for reports and documents.
How flint-chart works
flint-chart can connect to an MCP client through a local stdio server using npx -y flint-chart-mcp or through the documented hosted HTTP endpoint. Listed clients include GitHub Copilot in VS Code, Claude, Claude Code, Codex, and Cursor. After configuration, users can verify access by asking the agent to list available chart types.
flint-chart application development starts with installing the npm library and the renderer dependencies needed for the project. A specification describes data values, semantic field types, chart encodings, and optional theme and interaction settings. React applications pass that specification to the provided chart component, while interaction events can drive application updates such as filtering a table.
Who flint-chart is for
flint-chart serves people who want charts inside AI assistant conversations and developers building agent applications, dashboards, or data stories. Conversational workflows can produce interactive charts or static output. Development workflows can embed charts into an existing layout, connect selections to application state, or generate editable charts for documents.
- flint-chart can compare stock performance with hover inspection in an agent conversation.
- flint-chart can plot monthly users by region with a region selector.
- flint-chart can generate editable Excel charts for reports.
- flint-chart can connect chart brushing to table filtering.
flint-chart licensing and access
flint-chart is distributed as an open-source project under the MIT license. The repository documents access through the npm library, a locally configured MCP server, and a hosted MCP endpoint. The project text does not describe paid flint-chart plans or hosted-service pricing; the accompanying GitHub pricing material concerns GitHub products rather than flint-chart.
flint-chart strengths and limitations
flint-chart brings multiple rendering backends, reusable themes, and chart interactions into a common authoring model. The project includes a gallery, live editor, API references, agent skills, and guides for themes and interactions. Available JavaScript interfaces support both React and vanilla JavaScript applications, while the MCP server provides a separate conversational access path.
- flint-chart local development requires Node 18+.
- flint-chart application setup includes installing the required renderer dependencies.
- flint-chart provides its Python port only as preview source, without a released package.
flint-chart FAQ
What is flint-chart?
flint-chart is an open-source visualization language that lets AI agents create charts from human-editable specifications. flint-chart combines data, semantic types, field mappings, themes, and interactions, then compiles these inputs into backend-native chart specifications for supported renderers.
Is flint-chart free?
flint-chart is an open-source project distributed under the MIT license, with source code on GitHub and an npm library. The project also documents local and hosted MCP access, but does not state separate pricing for the hosted endpoint.
Which AI assistants work with flint-chart?
flint-chart works through MCP clients, with GitHub Copilot in VS Code, Claude, Claude Code, Codex, and Cursor listed as examples. Users can configure a local stdio server or the hosted HTTP endpoint and then request charts within an agent conversation.
Which chart backends does flint-chart support?
flint-chart supports Vega-Lite, ECharts, Chart.js, Plotly, and native Excel charts through a unified interface. The project lists 52 chart types and describes compilation from shared chart specifications into backend-native output, including editable Excel charts.
Can developers embed flint-chart in an application?
flint-chart provides an npm library with React and vanilla JavaScript APIs for embedding interactive charts in applications, dashboards, and data stories. Developers supply chart specifications and can use interaction presets or the interaction API to connect chart events to application updates.
Does flint-chart support Python?
flint-chart includes a Python port in preview as source in packages/flint-py, but the Python package is not yet released. The documented application installation path uses the npm library, which provides React and vanilla JavaScript APIs.
From the community
No reviews yet
Be the first to review this tool. What you write helps the next person choose.