What is Line Graph Maker?
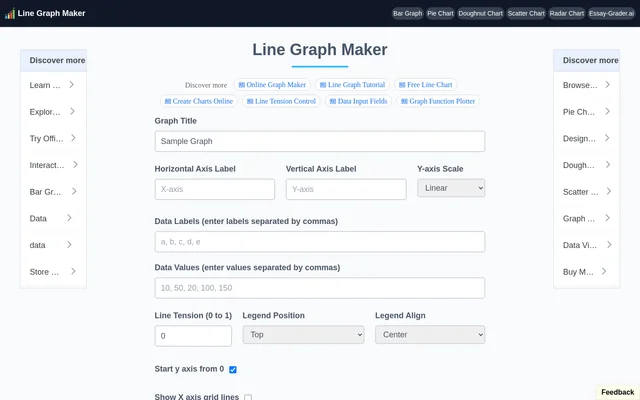
Line Graph Maker is a web-based chart creation tool for turning entered data labels and values into a line graph. Line Graph Maker offers fields for a graph title, a horizontal axis label and a vertical axis label, alongside controls for the chart’s appearance. The page centres on a graph-making form and provides instructions for entering data, adjusting the line and axes, and downloading the resulting graph.
Line Graph Maker combines data entry and visual settings in the same interface. The available options cover the Y-axis scale, line tension, legend layout, grid lines and point visibility. Download controls provide PNG, JPG and SVG output, allowing users to obtain the graph in an image format rather than only viewing the chart on the page.
What Line Graph Maker can do
Line Graph Maker provides controls for both chart labelling and visual presentation. Users can supply their own title and axis text, enter the labels and values to plot, and adjust how the line and surrounding chart elements appear. The Y-axis settings include a choice of scale and an option to start from zero.
- Line Graph Maker accepts comma-separated data labels and values.
- Line Graph Maker supports linear and logarithmic Y-axis scales.
- Line Graph Maker lets users adjust line tension and colour.
- Line Graph Maker offers legend position and alignment settings.
- Line Graph Maker can show or hide axis grid lines and points.
- Line Graph Maker exports PNG, JPG and SVG files.
How Line Graph Maker works
Line Graph Maker describes a manual workflow that starts with adding a graph title and horizontal and vertical axis labels. Users then enter data labels separated by commas and enter the corresponding data values in another comma-separated field. The instructions next cover adjusting line tension, deciding whether graph values should start from zero, and adding or removing grid lines.
Line Graph Maker also exposes legend position and alignment controls, a line colour selector and a point visibility option. Users can choose a linear or logarithmic Y-axis before downloading the chart. The page’s instructions mention JPG and PNG downloads, while the download controls additionally list SVG as an available output format.
Who Line Graph Maker is for
Line Graph Maker suits people who want to create a labelled line chart by entering their data directly into a web form. The supported tasks focus on plotting supplied labels and values, adjusting the chart’s presentation, and obtaining a downloadable graph. The page describes this chart-making workflow without identifying a particular professional audience or specialist industry.
- Create a line graph with a title and named axes.
- Plot supplied values using a linear or logarithmic Y-axis.
- Prepare graph images with customised legends and grid lines.
Line Graph Maker strengths and limitations
Line Graph Maker offers several presentation controls within a single graph-making form, including separate grid-line options for each axis and multiple legend settings. The combination of PNG, JPG and SVG downloads provides a choice of output formats. The stated workflow is manual: users supply comma-separated labels and values, then select the graph settings described on the page.
- Data labels must be entered as a comma-separated list.
- Data values must be entered as a separate comma-separated list.
- The described workflow requires users to supply the chart data.
Line Graph Maker FAQ
What is Line Graph Maker?
Line Graph Maker is a web-based tool for creating line graphs from comma-separated data labels and values. Line Graph Maker includes title and axis labelling, chart appearance controls, and download options for PNG, JPG and SVG files.
How do you create a graph with Line Graph Maker?
Line Graph Maker uses a form where users enter a graph title, axis labels, comma-separated data labels and corresponding values. Users can then adjust line tension, axis settings and grid lines before downloading the graph.
What file formats does Line Graph Maker support?
Line Graph Maker provides download controls for PNG, JPG and SVG files. The page’s written instructions mention downloading the finished line graph as JPG or PNG, while SVG appears as an additional download button.
Does Line Graph Maker support a logarithmic scale?
Line Graph Maker supports both linear and logarithmic Y-axis scales. Line Graph Maker also includes a control to start the Y-axis from zero and separate options for displaying X-axis and Y-axis grid lines.
Can you customise a graph in Line Graph Maker?
Line Graph Maker lets users customise the graph title, axis labels, line tension, line colour, legend position and legend alignment. Line Graph Maker also provides controls for point visibility, grid lines and the Y-axis scale.
From the community
No reviews yet
Be the first to review this tool. What you write helps the next person choose.